Volumetric Analysis of Martian Rampart Craters
(LPSC XXXVI Handout Abstract)
Summary: The Mars Orbital Laser Altimeter (MOLA) 128 pixels/degree global topographic data set [1], in combination with Viking 256 pixels/degree rectified Mars digital image model (MDIMs) [2] and Mars Orbital Camera (MOC) images, provide resolutions high enough to measure Martian rampart craters in detail sufficient to perform volumetric analysis on both the crater cavity and the ejecta blanket. Comparing ejecta volume to crater cavity volume may lead to insights about crater formation and surface structure.
Background: The morphology of the ejecta blankets of many Martian impact craters exhibits a lobate structure, with pronounced distal ridges bordering the ejecta facies. These craters have been termed rampart craters. The specific process which emplaces this type of ejecta is uncertain, but it may be some combination of a subsurface volatile component [3] and the Martian low pressure atmosphere [4]. Craters can provide a valuable tool to determine surface and subsurface properties, but the mechanics of their formation must first be understood. The purpose of this investigation was to develop a method for volumetric measurement of Martian rampart craters, and to analyze the data in terms of individual craters and potential regional trends.
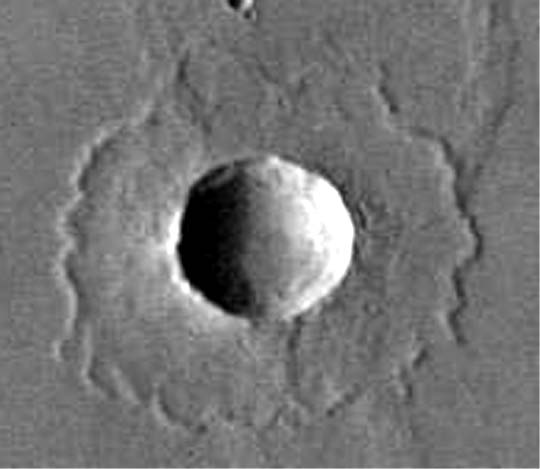
Methodology: The craters selected for measurement (~120) are all of the craters with sufficient MOLA resolution exhibiting rampart characteristics located on the ridged plains geologic unit [5] of Lunae Planum, in an area ranging from approximately -30° to 30° latitude and 45° to 90° east planetocentric longitude, comprising Viking quads MC-10 and MC-18. This area was selected because of its relative flatness and smoothness, wide latitudinal coverage, and the presence of ridges intersecting rampart ejecta blankets (Figure 1), offering a method of verification of ejecta thicknesses.
The system used for volumetric measurement involved several different software packages, which were combined to make the most consistent and efficient measurements possible. Craters in the field area were identified for measurement on Viking MDIMs (Figure 1). For each crater, an Excel worksheet was used to help automate the volume calculation process. A digital elevation model (DEM) was created from MOLA mission experiment gridded data records (MEGDRs) (Figure 2). Two profiles were taken from the DEM, one through the northern area of the ejecta blanket, and one through the southern area. North and south profiles were used because the MOLA profiles from which the global MEGDRs were interpolated run in strips from north to south, and only actual MOLA tracks, not global MEGDR interpolations, were measured in order to maximize accuracy.
 |
 |
|
|
Figure 1: Viking 256 pixels/degree MDIM of a rampart crater at 16.39° N 65.38° E. Crater diameter is approximately 14 km. Note ridges overlain by ejecta blanket. |
|
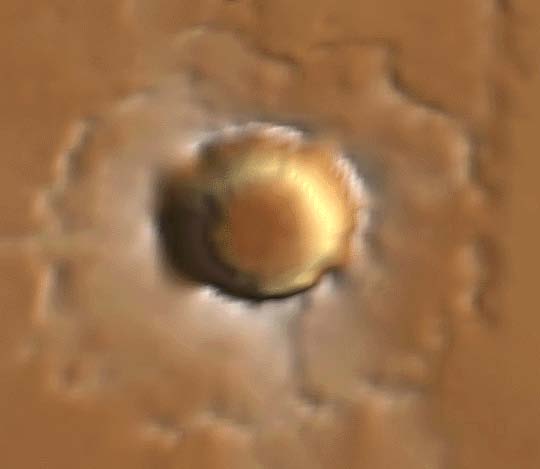
Figure 2: MOLA 128 pixels/degree MEDGR image of the crater in Figure 1. Color is elevation based; vertical resolution is exaggerated 6x. Note low resolution interpolated area on lefthand side of rim. |
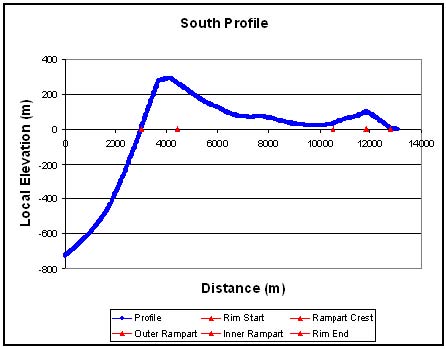
The profiles of each crater were separated into three sections: rim, ejecta blanket, and rampart (Figure 3). The rim section was defined as the distance from the point at which the interior of the crater intersects the pre-impact surface to 1/5 of the crater radius outwards. The rampart section was defined as the distance from beginning of the upslope section at the edge of the ejecta blanket to the end of the downslope section. The ejecta blanket was defined as the distance between the end of the rim and the beginning of the rampart. These parameters were adjustable, and were altered to best fit each profile. Crater rim perimeter, ejecta rampart perimeter and ejecta area were calculated using Viking 256 pixels/degree MDIMs and the ImageJ image processing program. Total ejecta volume was calculated by adding the cross sectional area of the rim multiplied by the crater rim perimeter to the cross sectional area of the rampart multiplied by the rampart perimeter to the average ejecta thickness multiplied by the ejecta area. The crater cavity was measured using the Gridview gridded topographic data analysis program [6].
 |
|
Figure 3: MEGDR Profile of the southern ejecta facies of the crater in Figure 1. Profile has been separated into rim, ejecta, and rampart areas. Note scale difference (vertical exaggeration ≈ 10x).
|
This particular system of volumetric calculation was used for several reasons. Based on observed characteristics, rampart crater ejecta seems to be emplaced as a continuous flow, on top of existing topography. Averaging ejecta thicknesses over the entire area based on sample profiles helps to ensure that topographical highs or lows are not included in the ejecta volume. Additionally, MOLA MEGDR data are interpolated between MOLA tracks. This interpolation can be very inaccurate, especially in areas with large topographical variations over short distances (e.g. crater rims (Figure 2) and ramparts). Using only actual MOLA tracks to approximate ejecta volume, rather than the interpolated MEGDR, bases the ejecta volume calculation on the most accurate data available.
Results and Analysis: The measured ejecta and cavity volumes were corrected to account for ejecta bulking, structural rim uplift [7], and down-driven cavity material [8]. Since the methods of cavity correction were based on simple crater models, the data set was constrained to simple craters, based on observed characteristics. The average corrected ejecta volume to excavation cavity volume ratio was 1.03, with a standard deviation of 0.44. Best fit power regression formulas were applied to both ejecta and excavation cavity volumes vs. crater diameters, yielding formulas of Vej = 0.0194 Df 2.7163, and Vec = 0.0254 Df 2.6283, with R2 values of 0.69 and 0.78, respectively.
These data suggest that despite a range of specific morphological differences between craters, the methodology and corrections are valid. Craters with especially high or low volume ratios were examined visually to determine the cause of the volume difference. Craters with low ejecta to cavity ratios often had eroded ejecta blankets. Craters with high ejecta to cavity ratios showed pedestal characteristics [9] or evidence of infilling of the crater cavity caused by either mass wasting or complex characteristics such as central uplift.
Although no regional trends were observed over the entire field area, smaller, more specific areas may display trends in volume ratios, implying differences in surface ages or characteristics. Continuing research will examine such trends to better understand Martian surface characteristics and crater morphology.
Acknowledgements: This work was partially supported by the Rhode Island Space Grant Consortium, and the Maine Space Grant Consortium SG-04-32. The author would also like to thank the NASA Northeast Regional Planetary Data Center at Brown University, P.H. Schultz, Bates College and the Bates College Geology Department, and Gene Clough.
References: [1] Neumann, G.A. et al. (2003) LPSC XXXIV, 1978. [2] Archinal, B.A. et al. (2003) ISPRS Workshop. [3] Carr, M.H. et al. (1977) JGR, 82, 4055-4065. [4] Schultz, P.H. and Gault, D.E. (1977) JGR, 84, 7669-7687. [5] Scott, D.H. and Carr, M.H. (1978) USGS Map I-1083. [6] Roark, J. et al. (2004) LPSC XXXV, 1833. [7] Melosh, H.J. (1989) Impact Cratering, Oxford. [8] Croft, S.K. (1980), LPSC XI, 2347. [9] Mitchell, D.E. et al. (2002), LPSC XXXIII, 1805.